Organizations today are deeply dependent on their IT infrastructure, so system downtime translates directly to costly business disruptions. Accordingly, it’s critical to have server monitoring tools that provide the insight into your on-premises and cloud systems you need to prevent and detect operational and security issues. This article outlines the key functionality and benefits of server monitoring, and then describes the top solutions currently available.
Key Functionality of Server Monitoring Tools
The core functions of server monitoring include:
- Data collection and analysis — Server monitoring software collects and analyzes data from servers and other IT components across your network. In particular, this can include can include security and event logs from your Windows servers.
- Server performance monitoring — Metrics such as CPU usage, memory utilization, network traffic and server uptime help operations teams track server performance and intervene to prevent slowdowns and business interruptions.
- Alerting — Many server monitoring solutions can alert security personnel about threats to Active Directory or cloud environments. Some systems use artificial intelligence (AI) and machine language (ML) to analyze user behavior and spot anomalies or suspicious traffic patterns.
Benefits of a Server Monitoring Solution
Server monitoring tools offer substantial benefits, including the following:
- With insight into the status and performance of critical IT infrastructure components, operations teams can proactively identify and remediate issues to reduce system downtime and help ensure the availability of business services.
- Real-time visibility into the performance of servers and other components of the IT stack helps server admins optimize resource allocation to critical servers and business applications, enhancing the experience of internal users and customers.
- Server monitoring tools can detect unusual activity across even enterprise-size IT estates, enabling IT teams to prevent security breaches and maintain data integrity and confidentiality.
- Server monitoring software can help businesses achieve and prove compliance with the requirements of industry and government regulations.
Overview of Server Monitoring Solutions
With so many benefits, it isn’t a question of whether you need to monitor your servers and other critical network components, it is a matter of which solution is right for your organization. Below is a short list of popular server monitoring solutions available today that support Windows. Some are geared more towards performance metrics while others focus on security; some are better suited for smaller businesses while others are robust enough to serve larger enterprises. Many of them offer free trial periods that allow you an opportunity to kick the tires.
Note that these solutions are not listed in order of preference or recommendation. You will need to decide which one works best for your needs.
Paessler PRTG Network Monitor
Key features:
- On prem or cloud-hosted monitoring
- Automatic network discovery of assets across the entire IT estate
- Multiple licensing plans
- Automated alerts
- Customizable templates and dashboards
Paessler PRTG is a comprehensive network monitoring tool designed for monitoring network equipment, servers, applications and other IT resources. Deployment is quick — thanks to preconfigured device templates, PRTG can intelligently select suitable sensors and configuration settings for each detected device.
You can view the entire server environment using customizable dashboards and reports that provide crucial information on CPU load, hard disk capacity and performance, and bandwidth usage. PRTG can send email and SMS alerts, which you can customize according to your desired thresholds and even fine-tune for individual servers to minimize false positives.
A 20-day or 30-day trial license lets you sample the tool, though the free version provides restricted functionality. There is also a freeware version that includes 100 free sensors.
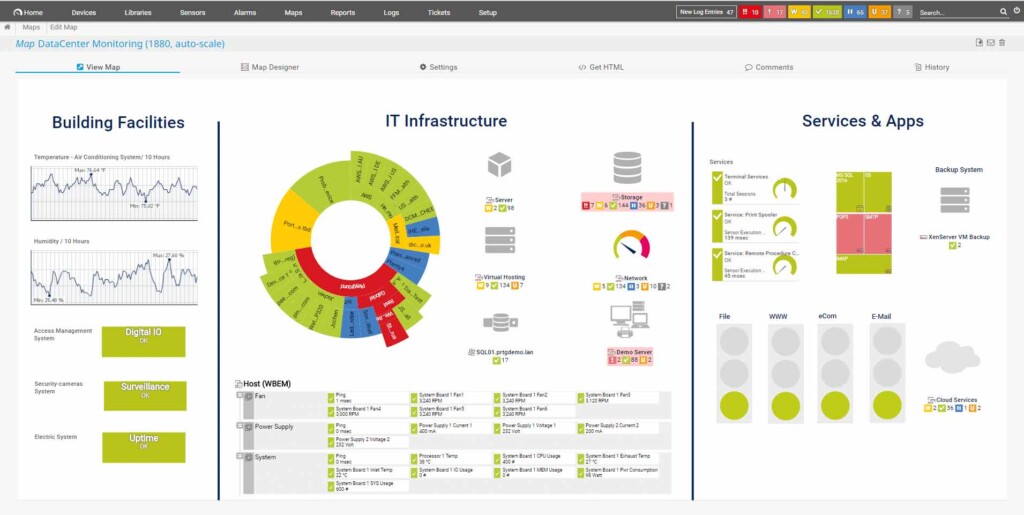
Image source : https ://hlassets.paessler.com/common/files/screenshots/prtg-v17-4/basics/map-data-center.png
Observium
Key features:
- Web-based interface that displays real-time and historical performance metrics
- Support for a long list of devices from Windows, Cisco, HP, NetApp, Dell, Juniper and more
- Automated network mapping
- Two fixed pricing models for unlimited devices, ports and sensors
- Traffic accounting features that ease the process of tracking and billing customer bandwidth usage
Observium is a robust platform for network monitoring and management that handles a wide range of devices. Once the tool is established on a single server in your network, you can conveniently access it via a dedicated URL. Observium also supports data collection and graphical performance counters for Apache, MySQL, BIND, Memcached, Postfix and other services.
To enable automatic detection and SNMP data collection, you enter the IP ranges for your network segments. Network devices can also be detected through CDP, LLDP or FDP. Advanced data visualizations include diagrams and graphs of crucial system metrics like CPU usage, RAM, data storage, power supply and temperature.
Observium is available in professional and enterprise editions, both of which offer daily security updates, bug fixes and access to new features. A free community edition is also available. Registered charities and open-source projects are eligible for complimentary subscriptions to the professional edition.
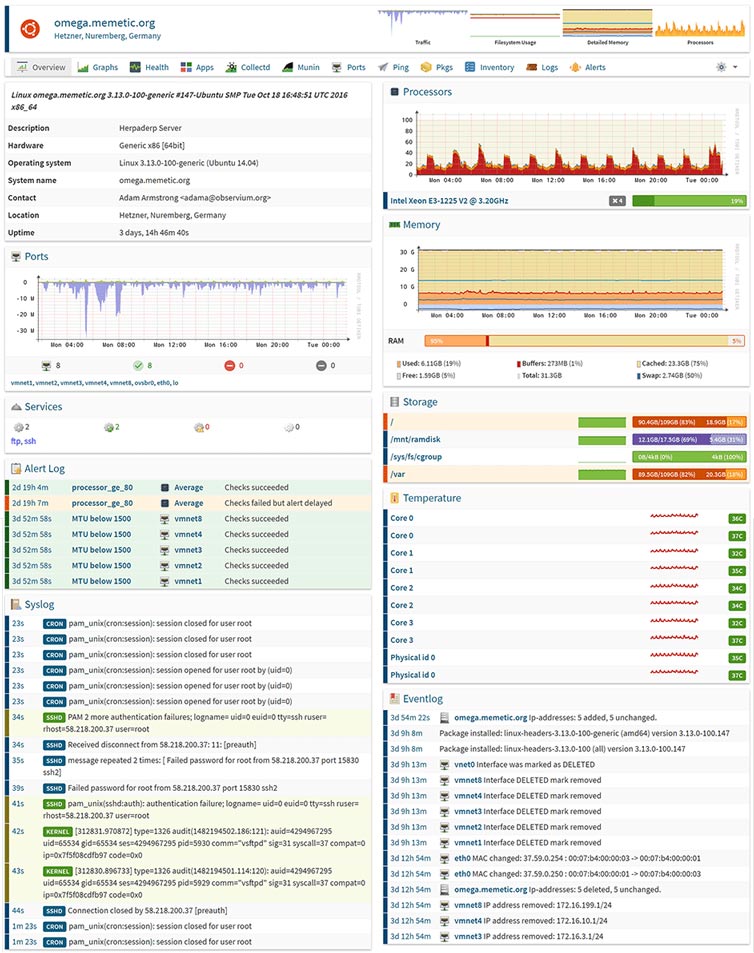
Image source: https://www.observium.org/images/ss-dev-linux.png
Netwrix Auditor for Windows Server
Key features:
- Designed to help organizations improve security, pass compliance audits and optimize IT operations
- Identifies and ranks data and infrastructure security gaps to prioritize protection efforts
- Reports on current Windows Server configurations and compares them to known good baselines
- Alerts on critical security events with the context required to enable fast and effective response
- Can alert on changes to permissions, scheduled tasks, services, user accounts, registry settings, etc.
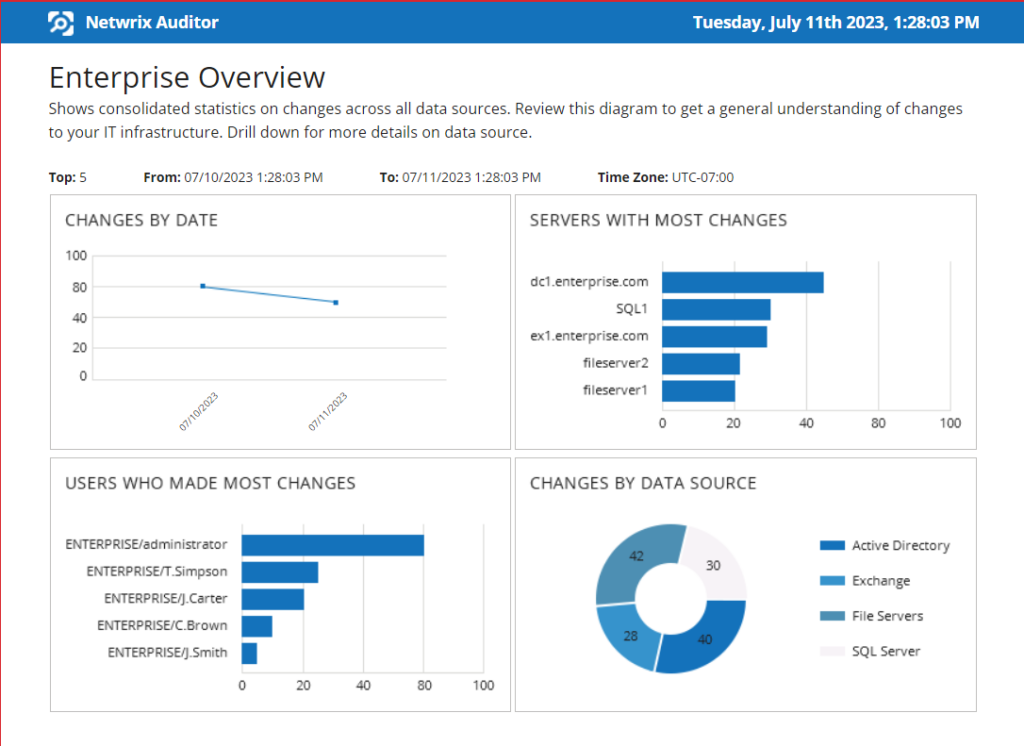
Netwrix Auditor delivers complete visibility into what’s going on in your Windows Server environment. Unlike some of the other solutions listed here, this Windows Server monitoring software is focused primarily on security, from server configuration to suspicious user activity. It alerts your teams whenever a risky change is detected, including the installation of software and hardware and modifications to access permissions, scheduled tasks, local server accounts, services or registry settings.
The Netwrix Auditor suite includes multiple auditing solutions that give you complete visibility into not just Windows Server but Active Directory, network devices, VMware, Oracle Database, Windows file servers and more. What’s more, these tools are integrated so you can monitor and manage your environment from a single web interface, instead of having to juggle multiple auditing and reporting tools to track your various on-prem and cloud-based systems. Netwrix Auditor provides predefined reports and overview dashboards for each audited component, and enables you to easily filter, sort, export and drill down into the data.
Netwrix provides an online demo of its Windows server monitoring tool and other monitoring solutions. A free community edition provides reporting on user activity in your environment. And you can try out the full Netwrix Auditor suite for free for 20 days.
Datadog
Key features:
- End-to-end visibility into on-prem and cloud networks, including application layer performance
- SaaS-based infrastructure monitoring that provides metrics, visualizations and alerting
- Monitoring of the health of traffic between any two endpoints at the app, IP address or process layer
- Machine learning-based tools that reduce noise and false positives
- Ability to reduce cloud networking costs by identifying large resource usage and traffic flows
While Datadog can be categorized as an artificial intelligence for IT operations (AIOps) solution, it offers important monitoring services. Its single-pane-of-glass interface combines infrastructure surveillance, application performance tracking and log management. Unlike some of the other solutions mentioned here, Datadog is SaaS-based, so you don’t have to worry about installing, maintaining or updating a dedicated server application. It deploys anywhere, including on-prem, hybrid, IoT and multi-cloud environments, and supports more than 500 popular technologies using tens of thousands of metrics.
Datadog is popular with service providers for its simple cloud-hosted model, customizable view and ability to seamlessly aggregate metrics and events across your full stack. Whether you want to ensure the health of bare-metal appliances or gain insight into application layer performance, Datadog can help you. Organizations with a significant cloud presence will appreciate its ability to analyze traffic to Amazon S3 and other cloud providers. Because Datadog is a SaaS solution, pricing is based on usage rather than a one-time purchase or a subscription. Datadog offers unlimited 14-day access to their service.
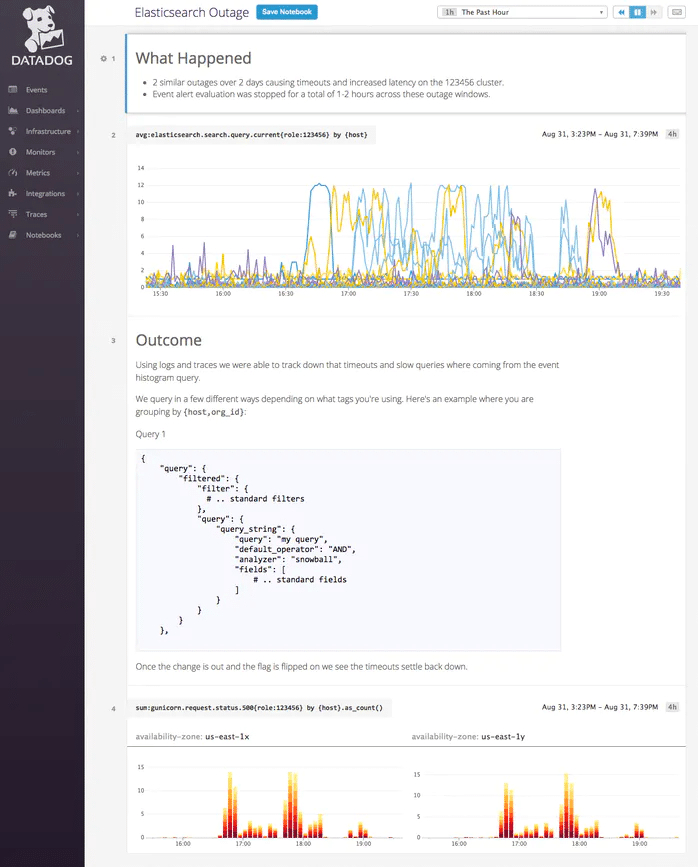
Image source: https://imgix.datadoghq.com/img/blog/data-driven-notebooks/notebooks_postmortem.png?auto=format&fit=max&w=698
Atera
Key features:
- Provides remote monitoring and management, remote access, helpdesk, billing, and reporting capabilities in a single package
- Offers a per-technician subscription plan that includes unlimited devices
- Creates an automated view and comprehensive inventory of all assets in your network
- Automates the patching process for Windows, Mac and most other software types
- Integrates with all the leading remote access solutions today
Atera is an integrated solution that includes comprehensive remote monitoring and management, remote access, helpdesk, billing, and reporting. Its unique pricing model bills per technician rather than per device, so you can manage an unlimited number of devices at no extra cost. This makes it a budget-friendly option for managed service providers (MSPs). Plus, support technicians can monitor all client devices and users from a single dashboard.
Atera is compatible with many widely used remote access solutions, such as TeamViewer, Splashtop, AnyDesk and ScreenConnect, simplifying remote support. Moreover, Atera’s built-in ticketing system facilitates email communication and can trigger automatic ticket creation from alerts. It also features automatic patch management for Windows and Mac devices, ensuring all systems and software stay current with the latest security updates.
Atera provides comprehensive visibility and control, enabling proactive measures to avert issues in managed environments. Alert thresholds can be defined for various performance categories, including CPU load and disk usage. Atera also offers scripts that run automatically in response to specific triggered alerts, such as the need to reboot a device. However, Atera lacks the report customization capabilities found in some other solutions.
Altera offers pricing plans tailored for both IT departments and MSPs. Prospective users can explore the solution through a 30-day free trial.
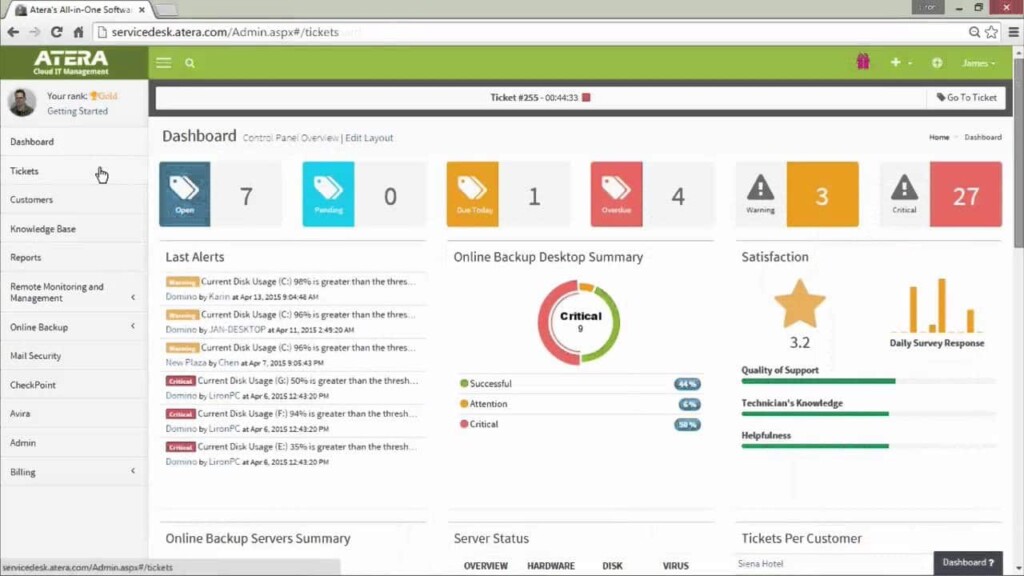
Image source: https://cdn.mos.cms.futurecdn.net/5bhsnY9MwnwJgDNZk5Lxp6.jpg
OpsView Monitor
Key features:
- Out-of-the-box monitoring for the complete Windows Server stack
- Monitoring of Exchange Online, SharePoint Online, OneDrive and other Office 365 applications
- Easy-to-use wizard for computer discovery
- Detection of rogue processes that consume excessive server resources or interrupt processes
- Insight into leading virtualization and container environments
Opsview Monitor is a comprehensive monitoring solution that is widely used by both IT departments and service providers. Key features include customizable dashboards, business service monitoring, alerts, reports and graphs, process maps, and infrastructure auto-discovery. It provides visibility into the entire Microsoft environment, including Active Directory, Azure, SQL Server, Hyper-V and Office 365 applications. It also supports other platforms, including Linux, VMware and AWS. Opsview Monitor integrates with other Opsview products and add-ons.
There are three subscription plans to fit different needs. The cloud version is ideal for organizations with up to 50,000 hosts, while its SMB version is better suited for organizations with less than 300 hosts. There is a free version with limited features that can be useful for SMBs with few active users. Opsview offers a free trial.
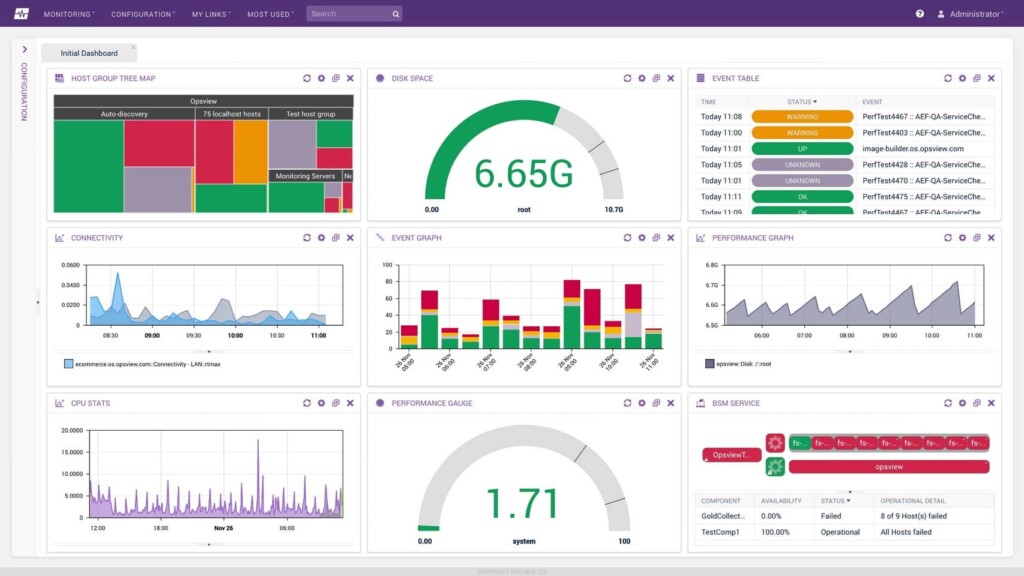
Image source: https://upload.wikimedia.org/wikipedia/commons/8/8d/Opsview_Monitor_6.0_Dashboard.jpg
Conclusion
Server monitoring solutions have different feature sets, but they all share a core objective: empowering operations teams and IT staff with deeper visibility into their network’s crucial elements. This list should help you find the right solution for your organization, whether you are focused on strengthening security or monitoring Windows Server performance.
Frequently Asked Questions
What is Windows Server monitoring?
Windows Server monitoring is the process of tracking the performance and health of machines running the Windows Server operating system. This includes monitoring performance metrics like CPU usage and memory utilization, as well as tracking the status of hardware components. Windows Server monitoring tools collect and analyze Windows event logs to identify potential operational and security issues, as well as assist in capacity planning.
How do I monitor Windows services on Windows Server?
The Windows Server operating system does include some monitoring tools, such as Windows Services Manager, Windows Event Viewer and Performance Monitor. While these tools are free, they lack the functionality that dedicated third-party monitoring tools offer. Native tools also operate in a siloed manner, forcing support staff to constantly toggle between them.
Accordingly, the most effective way to monitor services on your Windows servers is to use a quality third-party solution. There are a variety of Windows Server monitoring tool available that offer a wealth of functionality, and many also offer support for other platforms and devices.
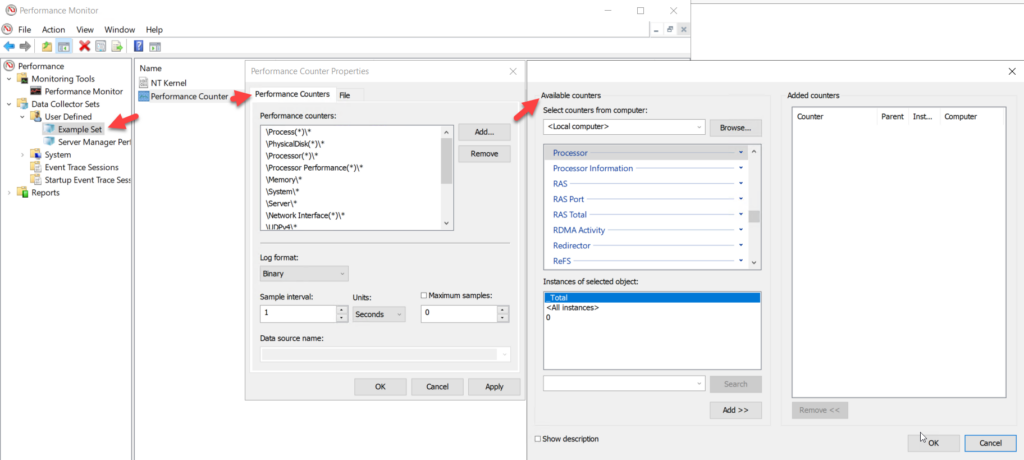
How do I run Performance Monitor on Windows Server?
To open Performance Monitor, type perfmon.msc in the Run dialog box. Then expand Data Collector Sets and select the desired Windows Server performance metrics. You can easily add additional performance counters to any set.