
Cyber attacks are becoming more common and more sophisticated every year, and cybersecurity professionals often find themselves struggling to keep up. Cyber attack maps are a valuable tool that can give them the information they need to stay ahead of attacks. Here are the top ten cyber attack maps and what you can learn from each of them.
#1. Trend Micro
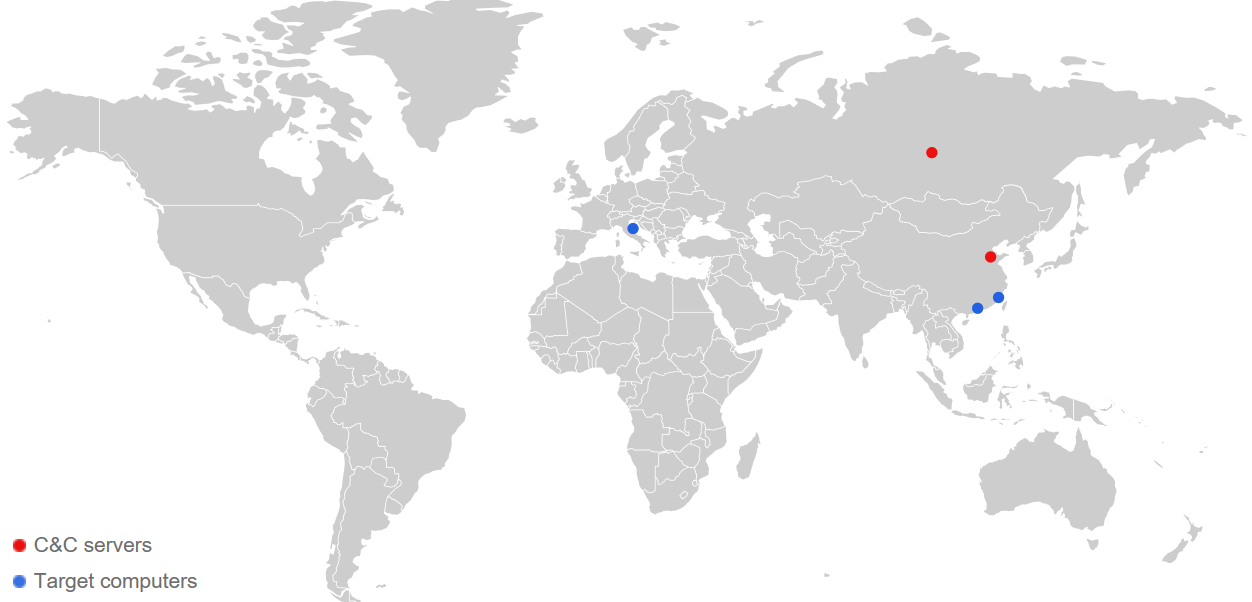
Botnet attacks —attacks orchestrated by hackers but carried out by a series of bot programs — are becoming more common as tech-savvy hackers take advantage of internet of things (IoT) devices that don’t always have the best security. The biggest attack of this type was in October 2016, when a botnet-enabled direct denial of service (DDoS) attack crippled most of the internet.
Trend Micro’s cyber attack map tracks botnet activity across the internet and identifies the Command and Control (C&C) servers orchestrating the attacks. Trend Micro doesn’t release any data about how often their map is updated, but they do watch trends over each two-week period, so the data probably isn’t much older than that.
This map can help cybersecurity professionals protect their systems from botnet attacks and respond much faster to attacks that do happen. Once a threat is identified and the corresponding C&C server has been located, they can take steps to combat the specific attack, rather than trying to block all botnet attacks in general.
#2. Norse
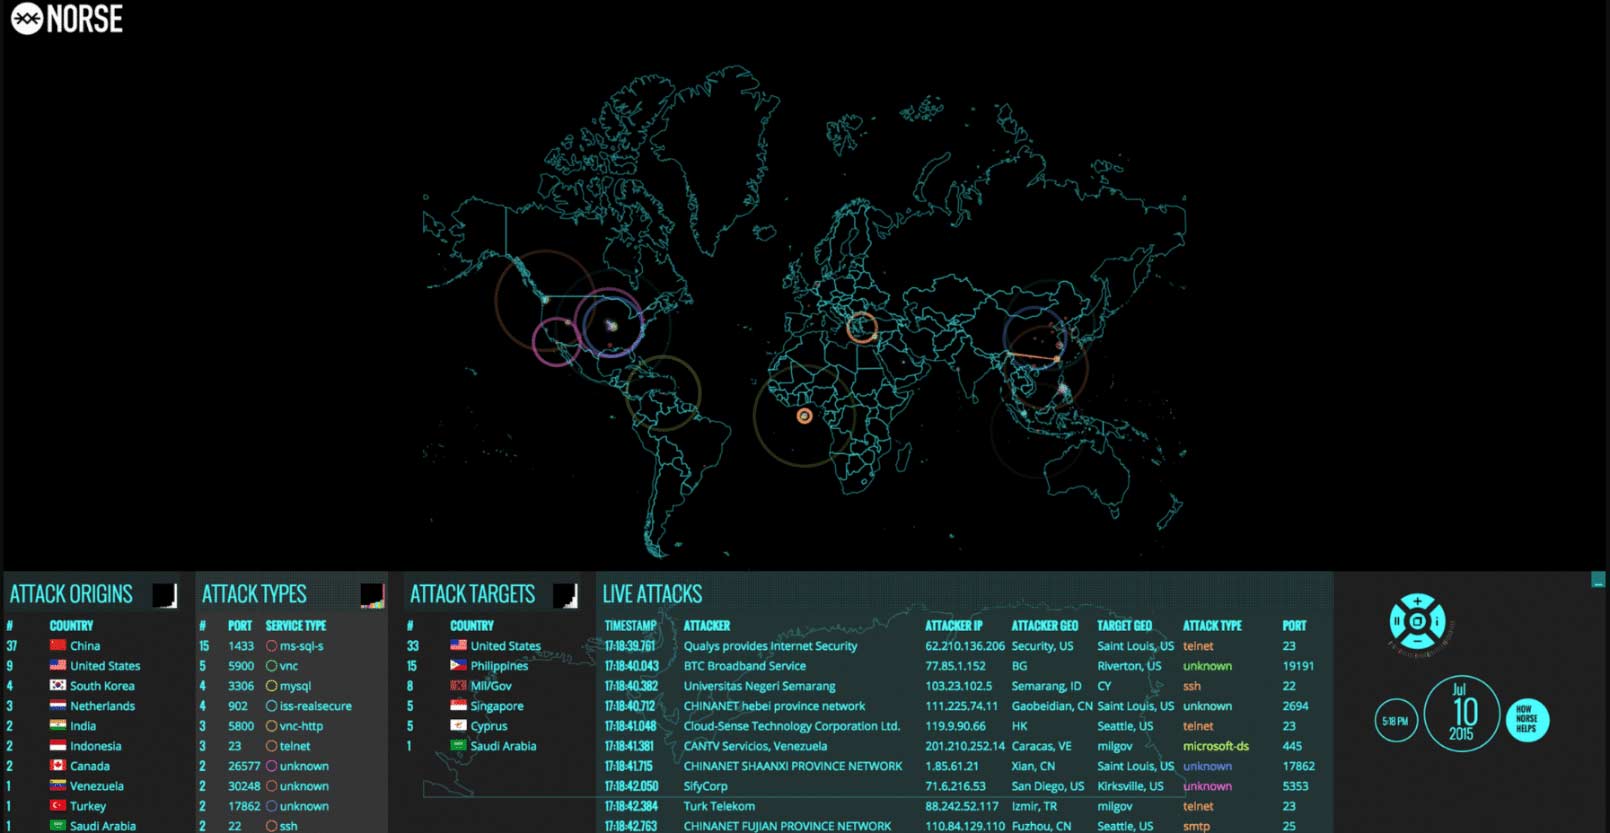
Norse’s live cyber attack map may be the most comprehensive one available to the public. The company claims to have the largest dedicated threat intelligence network in the world. It collects data from more than 8 million “sensors” — honey pots that convince hackers that they have broken into the targeted system when actually they have been diverted to a virtual machine that tracks their IP address, the tools that they’re using and other identifying information.
Norse’s map tracks attack types and origin points, and users can filter the map by protocol. This map is also capable of displaying a live feed of attacks as they are going on, making it the closest we’ve got to real-time tracking of current cyber attacks. It also keeps track of which services are being accessed through which ports in the attacks, making it easier for cybersecurity pros to determine which attacks might target their servers or systems.
#3. Akamai
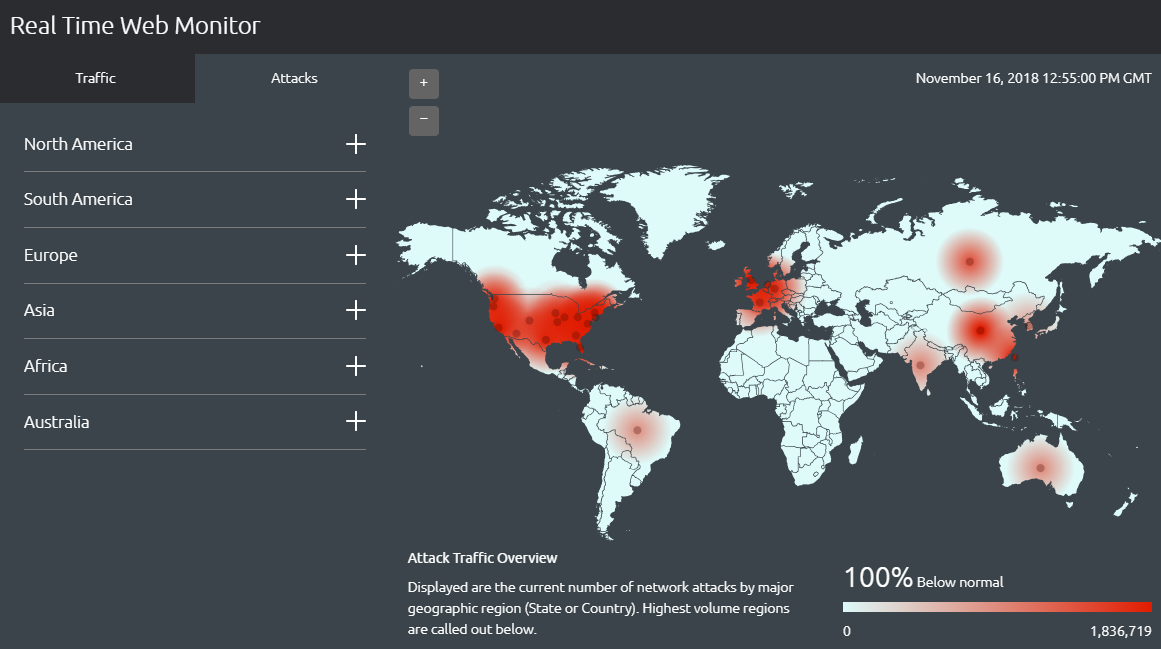
Akamai’s map is very simple: It tracks web traffic and real-time cyber attacks related to that web traffic, and enables users to filter the data by region. It doesn’t provide any additional information, such as the source of a cyber attack or the IP address of the attacker, as some other maps do. However, it can be a valuable tool for network administrators, IT professionals and anyone who runs a website. For instance, you can easily see whether a country where you have a lot of users is experiencing traffic slowdowns or traffic-related cyber attacks.
#4. FireEye
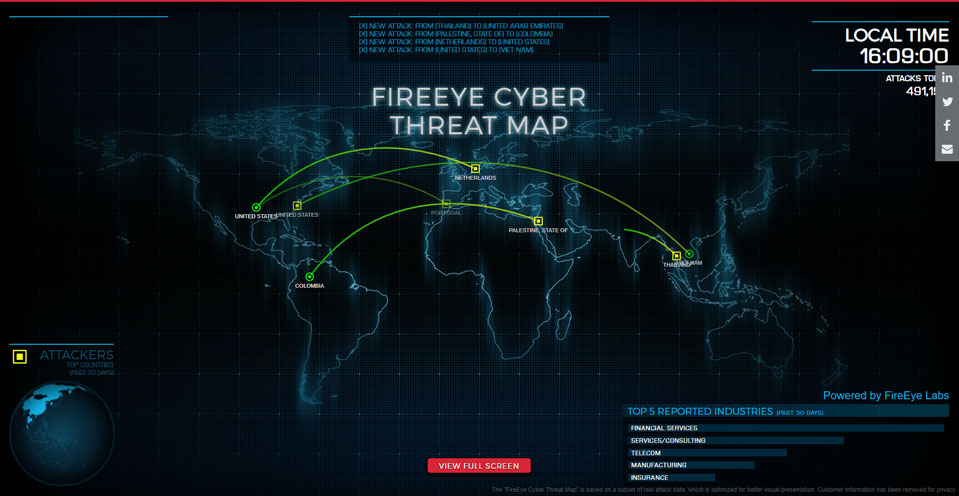
FireEye’s map is also very simple: It shows attacks as they happen, identifying the source and target countries, and it also lists the total number of attacks that day and the top five industries under cyber attack during the past 30 days. While it is more up to date than many of the other options on our list, it doesn’t provide the detailed analysis that some of the others do — there are no IP addresses, hacking tools or other identifying information on FireEye’s map.
This map is mostly useful for casual internet users or cybersecurity aficionados, but it could have applications in the cyber security industry. For example, cybersecurity pros could see if their industry or their country is being targeted and pinpoint the attacker’s country, so they could temporarily block all traffic from that country in question until the attack is stopped.
#5. Kaspersky
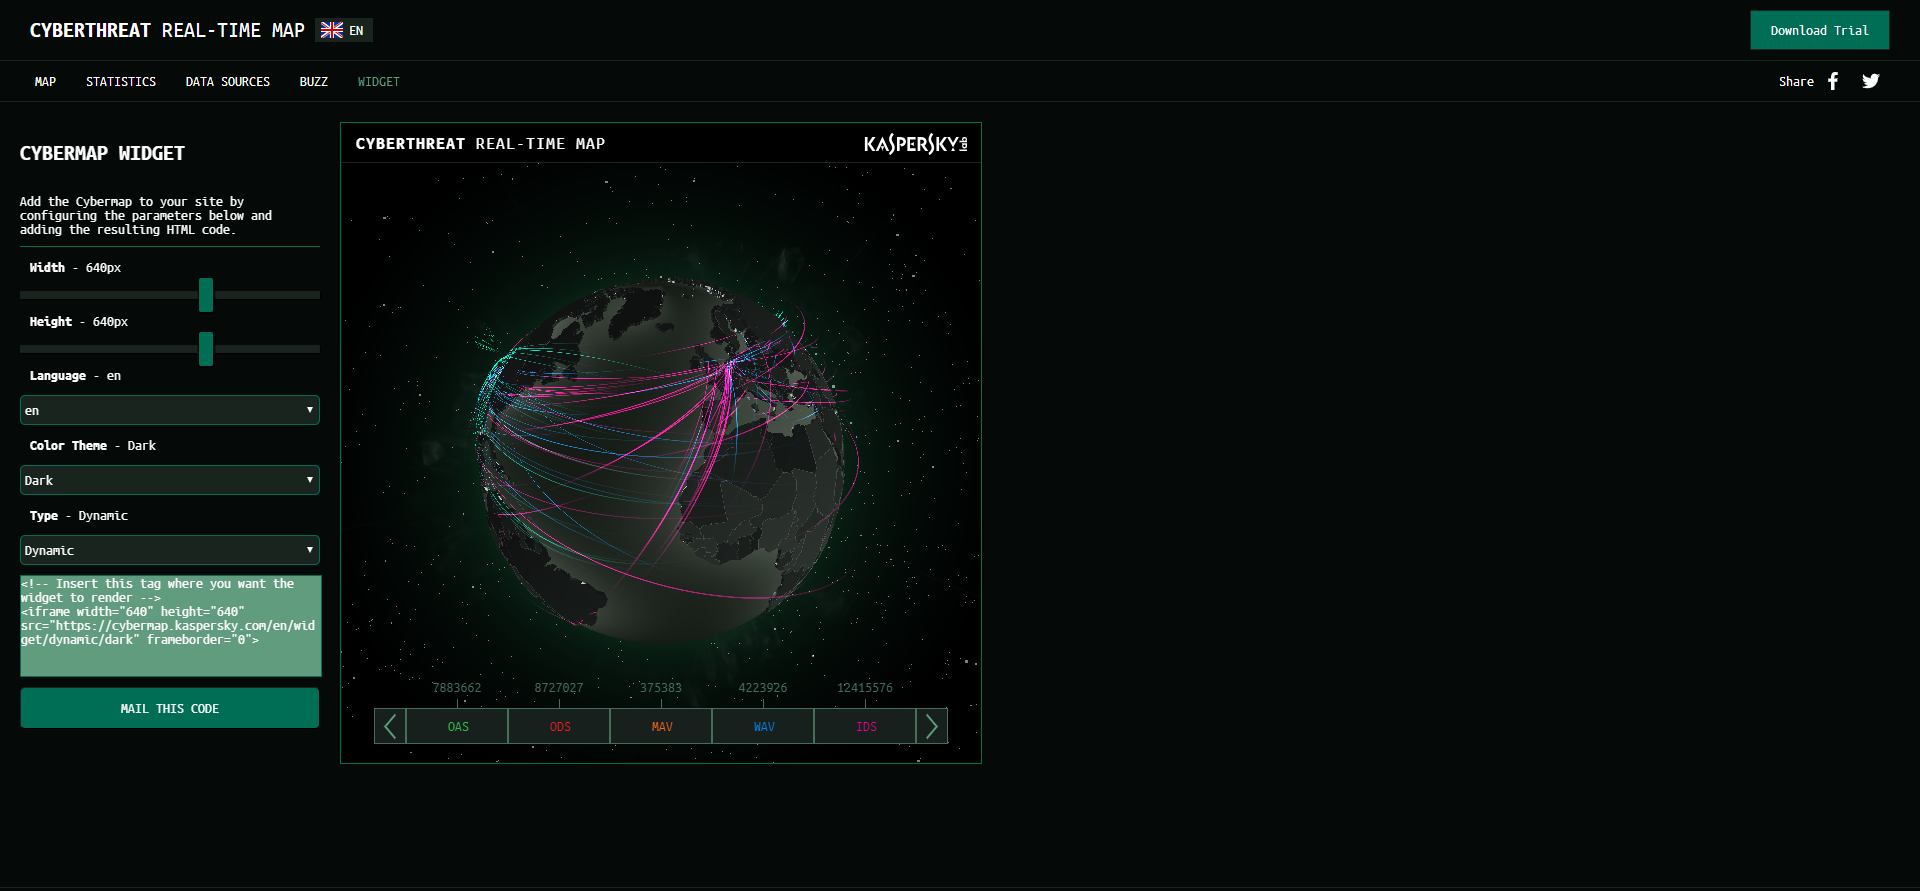
Kaspersky tracks attacks in real time on a massive, rotating, 3D representation of the globe. The map collates all the information gathered from a variety of sources, including an on-demand scanner, web and email antivirus programs, and intrusion and vulnerability scans. It also keeps track of botnet activity, much like the Trend Micro map.
If the 3D map is too much for your device, you can access the data in table form from the Stats menu, making it useful for tracking cyber attacks on the go. The attacks are color coded by data source and you can filter out any data source with one click, making it easy to see, for example, just intrusion-style hacks.
#6. Digital Attack Map
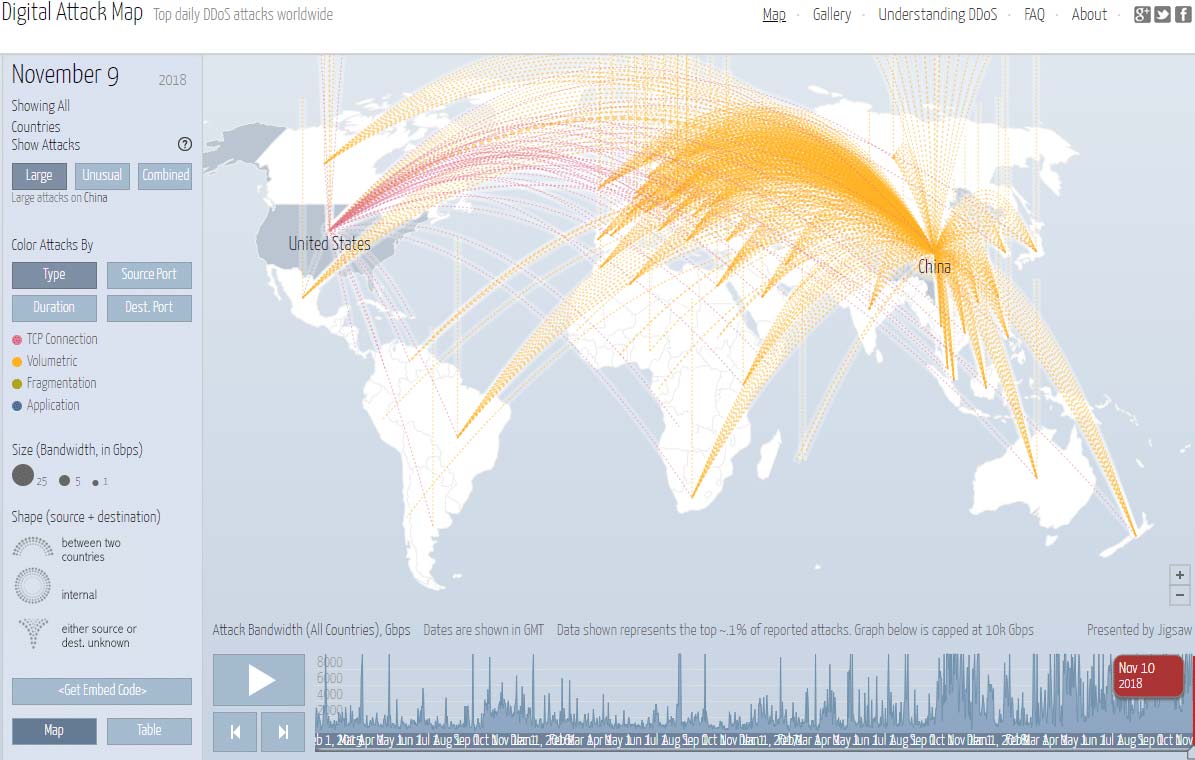
DDoS attacks are harmful for businesses both large and small. With more than 2,000 DDoS attacks reported daily, keeping track of those attacks can be beneficial for businesses — upwards of 71 percent of small businesses have a website that they use for orders, and a growing number of them have abandoned the brick-and-mortar storefront in favor of an exclusively online business model. Losing their store, even temporarily, to a DDoS attack can cost them dearly. In fact, anyone who maintains an online presence can suffer damage from a DDoS attack.
Digital Attack Map — a DDOS attack map built through a collaboration between Google Ideas and Arbor Networks — enables users to track DDoS attacks by size or type. Attacks are visualized as an arc that travels from the source of the attack to its target. The map is very simple to use, which makes it the perfect choice for business owners or anyone else who is concerned about their online presence.
#7. Threatbutt
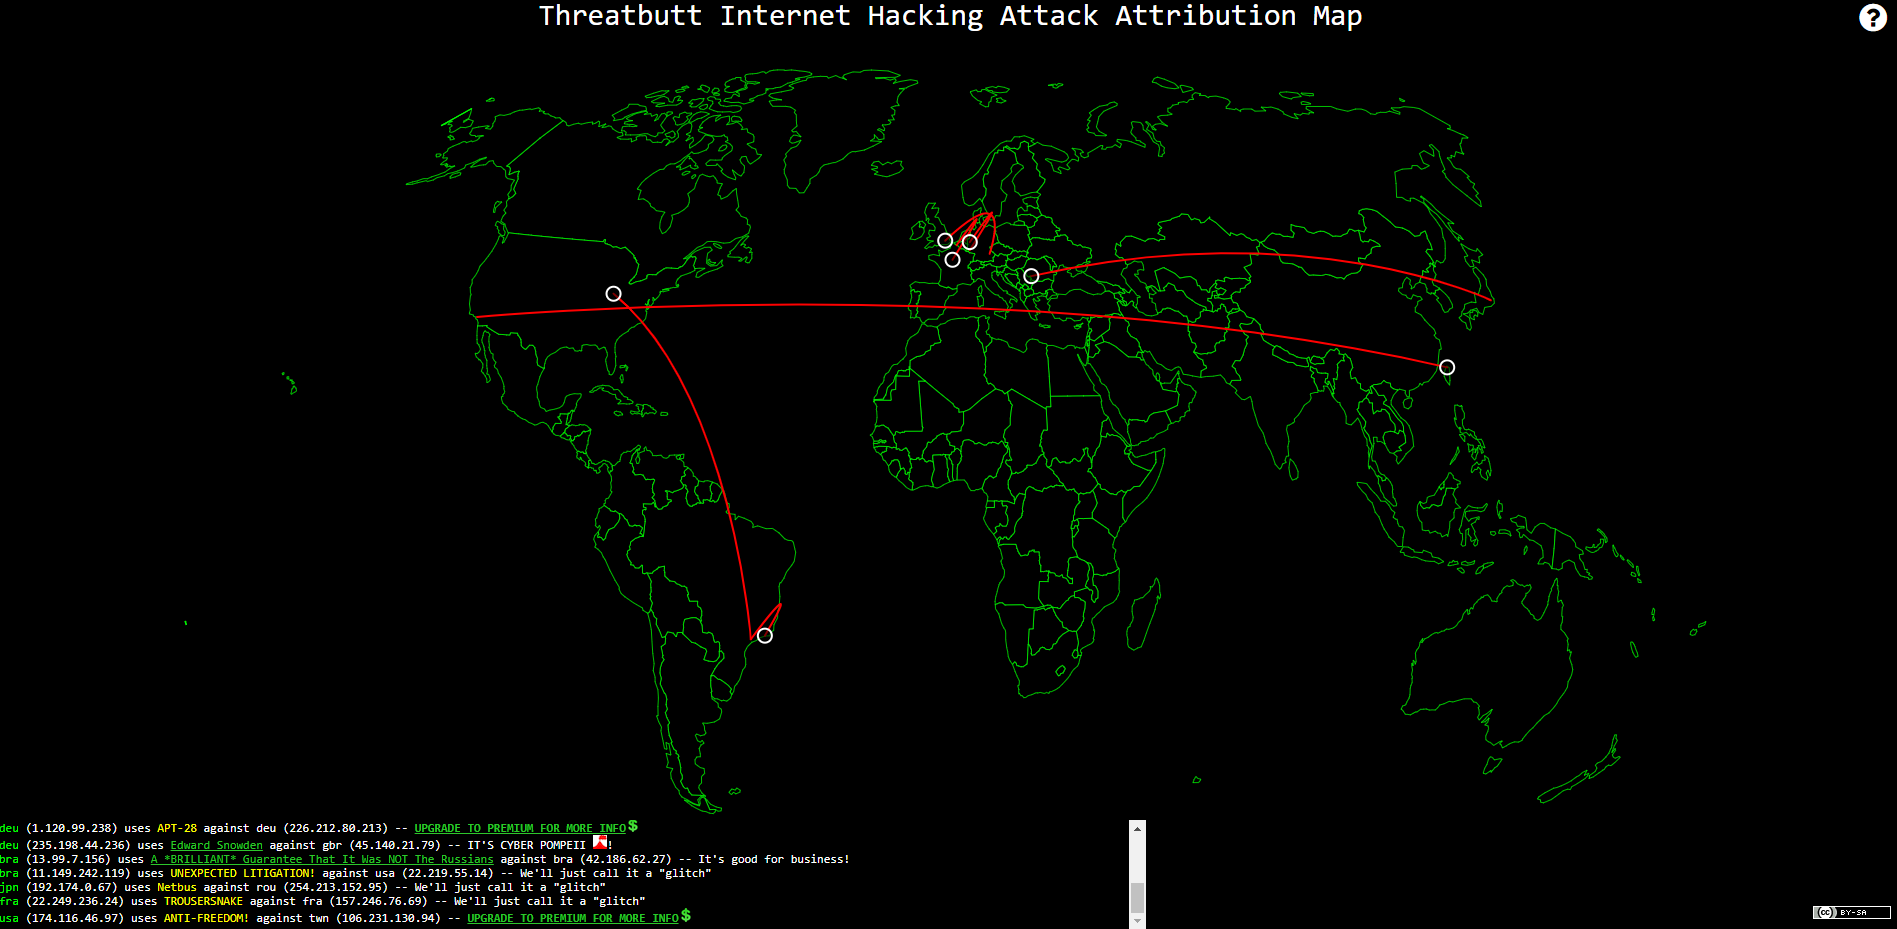
Threatbutt Internet Hacking Attack Attribution Map tracks cyber attacks in real time, showing the location and IP address of the source and target of each attack. It also adds small bits of commentary to indicate the severity of the each attack: Notes such as “We’ll just call it a glitch” indicate small or minor attacks, while things like “It’s cyber Pompeii!” indicate large or widespread attacks.
The map is free for anyone on the internet to use, but there is also a premium version that provides cybersecurity professionals with additional information that could be used to combat these cyber attacks.
#8. Check Point
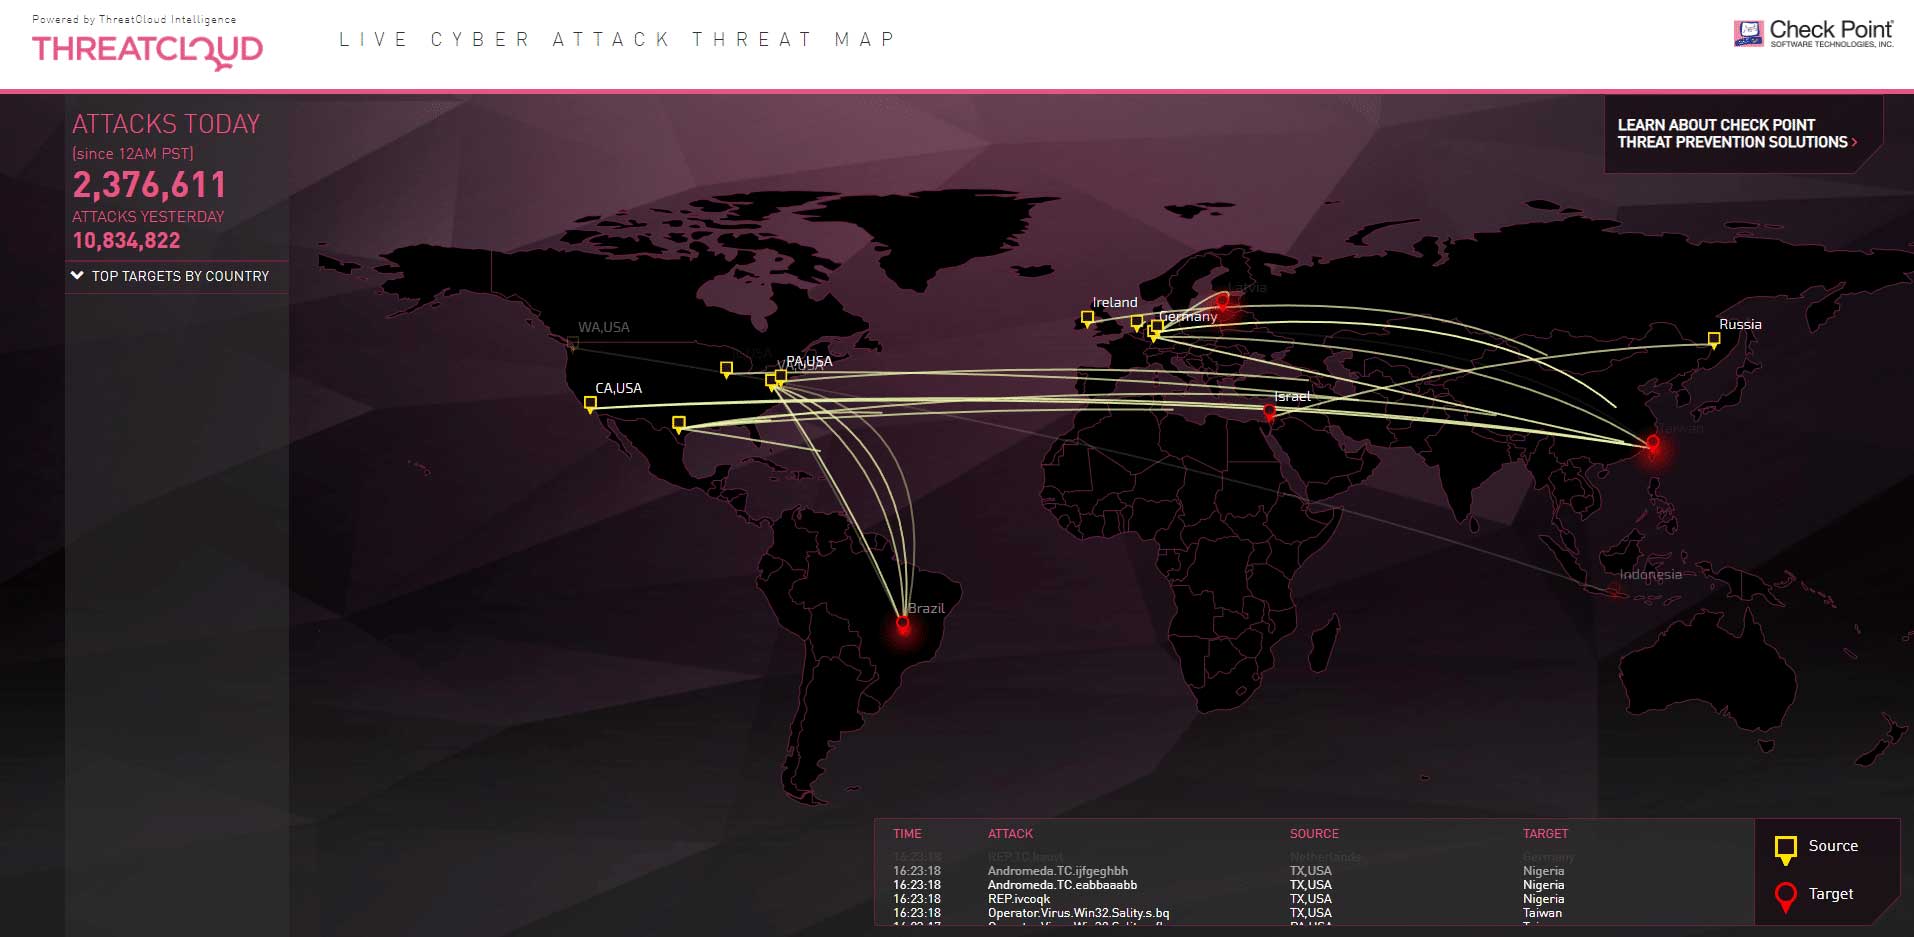
This isn’t a real-time cyber attack map, but that doesn’t make it any less useful. Visually, the map resembles the map on the Norse website, but the information that it provides is slightly different: Check Point’s map archives historical data and resets every day at midnight, Pacific Standard Time. This makes it a useful tool for cybersecurity professionals who are trying to track attack patterns over a period of time. The statistics collected by Check Point can be filtered by daily, weekly or monthly time periods. The information is very simple; it includes only the timestamp, name, and the source and target of each attack.
#9. Fortinet
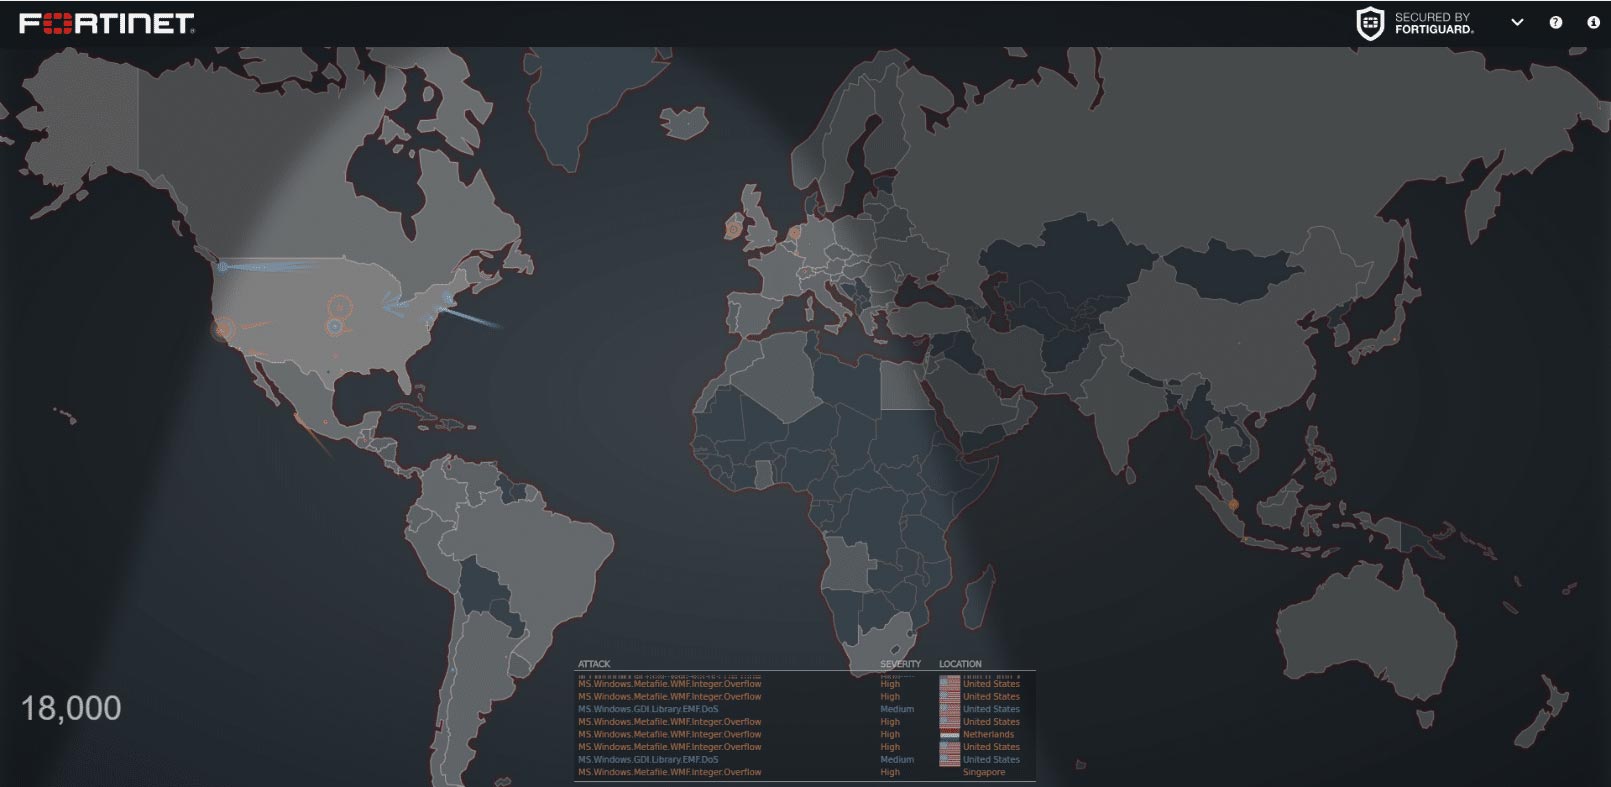
Fortinet’s map is created and supervised by FortiGuard Labs, Fortinet’s in-house security research and response team. It showcases a playback of recorded events, breaking down the attacks by color — red for critical attacks, orange for high severity, blue for medium and green for low. According to the site’s documentation, each user can create their own map to track attacks targeting a particular country or originating from a specific region. Users can also click on a country and see incoming and outgoing attacks.
This map is visually similar to the Norse map, but it is a lot more active; as soon as it loads, you can see attacks pinging across the map. The site maintains a massive database — 290 terabytes’ worth — of threat data samples, enabling it to identify nearly any threat that emerges.
#10. Deteque
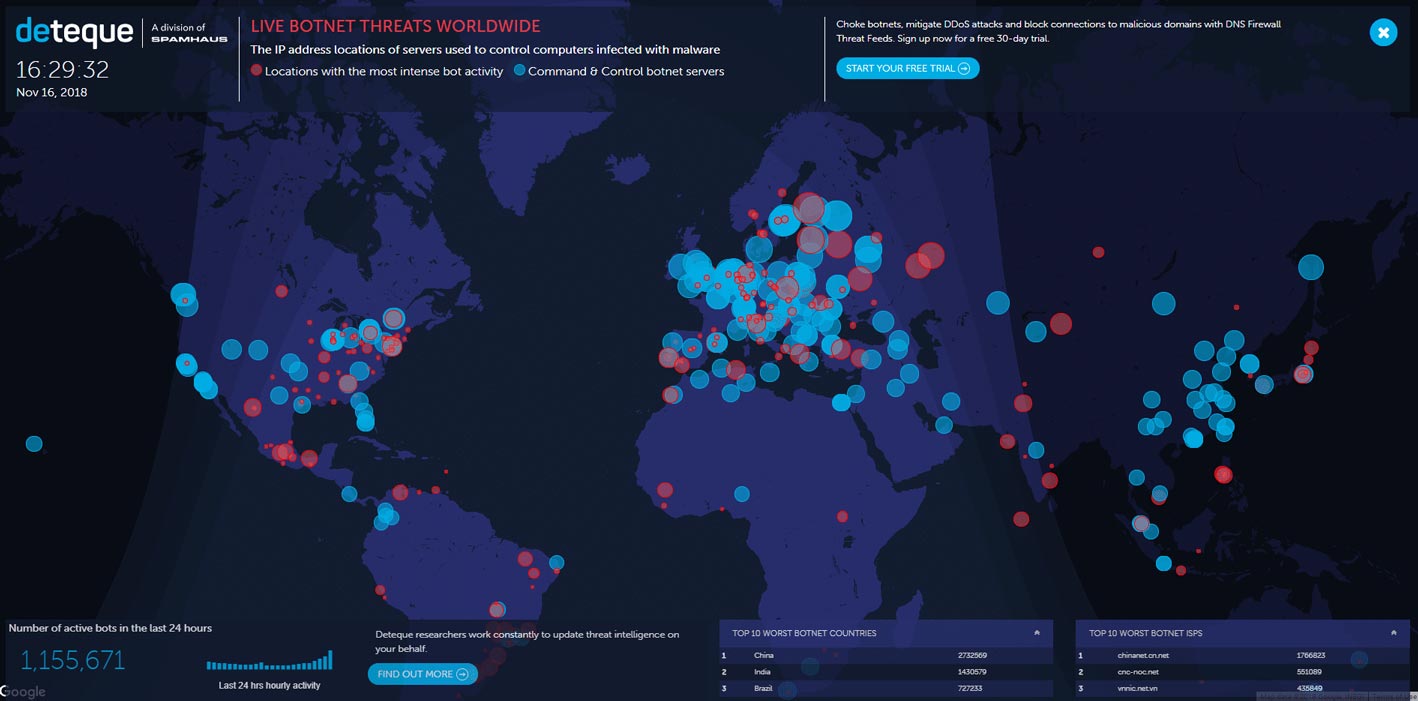
Deteque is another botnet attack map that provides a ton of useful information. It identifies areas with high botnet activity and probable botnet command and control servers. The larger the circle on the map, the more bots are active at that location.
The map might look like a mess when it’s fully zoomed out, but users can zoom in on any location to view more detail on the botnet attacks in that area, or click any of the dots on the map to see the number of bots in the location and their names. For IT professionals, this map can be a valuable tool for tracking botnet attacks in a specific location.
Conclusion
Cyber attacks are becoming more common every year as more and more devices are connected to the internet. The maps described here are an often overlooked tool that can help IT and cyber security professionals better secure their networks and prevent hackers from infiltrating their systems.