
Today, IT networks are the backbone of nearly every business. Simply put, if your network isn’t performing at its best, the flow of data and services will be impeded, and your business operations will suffer.
This modern reality makes effective server and network monitoring software not just a technical necessity but a business imperative. Fortunately, modern enterprise network monitoring tools provide far more than mere fault detection; they include network health monitoring software that helps you proactively maintain strong network availability and performance so that financial transactions, collaboration, and data-driven decision-making can continue unabated.
To empower you to keep your network — and your business — running strong with complete Network Access Management, this article details the four key types of network management tools and the goals they can help you attain. Then it reviews the top solutions available on the market to help you find the right network management tools for your unique needs.
What is Network Monitoring?
Network monitoring is a continuous process of observing and analyzing the network’s hardware and software layers to prevent and troubleshoot outages and failures.
Hardware monitoring focuses on physical components of the network, such as switches, routers, firewalls, and cables, in the Physical, Data link, and network layers of the OSI model. Software layer monitoring corresponds to monitoring different services and protocols running on the session, presentation, and application layers of the OSI model.
Key benefits of network monitoring:
- Early detection of issues: With continuous monitoring, device failures, bandwidth spikes, or slow performance get highlighted before users are affected
- Improved Network performance: Analysis of bandwidth usage, quick identification with prompt remediation of device failures, and bottleneck resolution keeps the network performance in optimal condition.
- Increased Network security: Monitoring tools can detect changes in traffic patterns, unauthorized access attempts, provide live alerts, and enforce automatic remediation plans to secure network security.
- Improved network visibility and control: A centralized and real-time view of the entire network infrastructure provides network maps, a clear understanding of network topology and interdependencies. This helps in making informed decisions for upgrades, changes, and troubleshooting issues proactively.
What is a Network Monitoring Tool?
Modern networks are a complex orchestration of hardware devices with hundreds of applications running on several servers connected to each other on internal network segments and outward internet-facing services and cloud infrastructure. Manual monitoring of vast amounts of data and configuration is not feasible; network tools with their powerful automated features provide detailed reports and dashboards to monitor hardware and software from web portals deployed on-premises or in cloud infrastructure.
Network tools help administrators monitor and analyze the performance and health of network resources and provide functionalities like auto-discovery of network devices, real-time alerts, schedule reports, monitoring dashboards, Pattern recognition, Anomaly detection, configuration, and change management.
Network tools monitor hardware devices with different parameters to gauge device performance, such as uptime, bandwidth usage, throughput, packet loss, jitter, and IP metrics. On the Software layer, monitoring tools employ techniques like Application performance monitoring (APM), Service and port monitoring, and agent-based monitoring on the OS level. Logs are gathered and analyzed to generate alerts.
4 Categories of Network Monitoring Tools
Network monitoring tools can be classified into the following 4 categories:
Performance monitoring tools are designed to track and analyze the operational efficiency and responsiveness of network devices, servers, and applications. The primary goal is to identify bottlenecks, optimize resource utilization, capacity planning, and reduce potential issues before they impact end users.
Availability monitoring tools are focused on uptime and accessibility of network resources and provide alert mechanisms to restore services in case of device or service failure. They continuously monitor resources with ICMP Ping (echo requests), SNMP Pooling, Services health checks, virtual machines’ health status, and generate status alerts, which can be viewed from their dashboard, mobile apps, or email.
Traffic monitoring tools provide detailed insight on what kind of data is flowing across the network, who is sending and receiving data, which applications are consuming highest bandwidth. They provide a clear picture of Bandwidth usage, help in troubleshooting performance issues, detect abnormal traffic that might lead to security incidents, and provide an assessment for bandwidth requirements for future needs.
Security monitoring tools focus on preventing unauthorized access, security threats, and vulnerabilities within network infrastructure. Provide functionalities to analyze alerts from Intrusion Detection/Prevention systems (IDS/IPS), monitor authentication attempts in logs, vulnerability scanning, and monitor the configuration of network devices.
Cloud monitoring expands the boundaries of network monitoring tools for network infrastructures hosted on cloud services and monitor cloud-based SaaS service integrated with on-premises applications. Nowadays, ready-to-use cloud services are on the rise and are an integral part of modern IT infrastructure. Cloud monitoring focuses on resource utilization, service availability, security logs, tracking billing, and cost optimization.
Performance Monitoring
Network performance monitoring is the process of reviewing the quality and efficiency of a network’s operations. Performance-focused network monitoring tools provide network admins with a holistic view of the network, allowing them to identify emerging performance issues and take steps to nip them in the bud.
Network performance monitoring involves analyzing real-time and historical metrics, such as bandwidth utilization, packet loss, latency, and response times, to ensure the network runs at its optimal level. Examples include:
- Checking the speed and reliability of data transfers
- Analyzing traffic patterns to identify potential bottlenecks
- Monitoring server response times for web-based applications
Performance-focused network device monitoring tools typically utilize techniques like SNMP alerts, event logs, syslog triggers, flow-based monitoring, packet capture analysis, and streaming telemetry.
Availability Monitoring
The purpose of availability monitoring, also known as fault monitoring, is to help ensure the availability of network resources and infrastructure. Specifically, availability monitoring tools provide real-time detection of issues ranging from hardware failures, such as a malfunctioning router, to software issues involving a critical web application or connectivity problems. The classic example is continually sending ICMP pings to all critical network devices and servers to check whether the resource is available. Another way is to use SNMP traps to alert about status changes in a networking device (i.e., interface up or down)
Availability monitoring tools often come with alerting mechanisms to notify administrators by email, SMS, dashboard alarms or other methods.
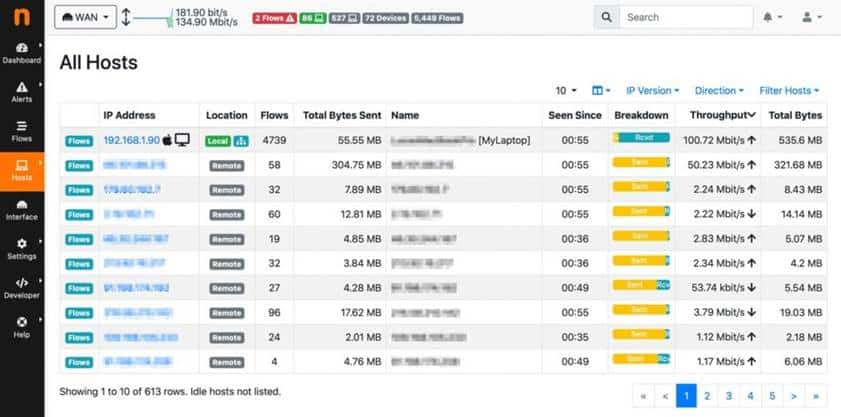
Traffic and Bandwidth Monitoring
An enterprise network is like the highway system of a large metro area: Everything slows down during rush hour. Since businesses cannot afford to have this happen to their IT operations, they need to ensure they have ample bandwidth.
Network traffic monitor software analyzes the flow of data across the network to help administrators understand who is using the network and for what purpose. It also provides bandwidth monitoring, which involves measuring the amount and speed of data transmission over a network to ensure optimal performance and avoid bottlenecks. Network trace tools help in troubleshooting by analyzing packets transmitted over the network to assist in identifying the source of network problems or slowdowns.
Security Monitoring
Security network monitoring is essential for safeguarding the integrity, availability and confidentiality of data and other IT resources and avoiding the steep costs of security-related disruptions. There are many types of security tools available on the market, including the following:
- Network logging tools collect, store, and analyze log data from various network devices to maintain a comprehensive record of all activities that occur.
- Network detection software continuously monitors network traffic to identify potential threats or malicious activities in real time so that immediate action can be taken against them.
- Network control software helps organizations manage and control network operations, ensuring that only authorized activities are permitted and that potential vulnerabilities are patched.
- Network surveillance software is used to monitor network activities vigilantly. These applications ensure that all data transmissions and activities adhere to security policies and that any suspicious or unauthorized activities are promptly detected and reported.
- Network device monitoring checks for unwanted changes to a device’s configuration. Changes to ACLs or Firewall rules can have a drastic effect on a network’s operation, and even worse, they can render a network unusable.
Together, these tools form a robust security framework that helps ensure a secure and optimized network environment.
Cloud Infrastructure Monitoring
Cloud infrastructure monitoring is needed to properly manage and secure cloud-based data, services, platforms, and other resources. Network connection monitoring tools track and analyze the connectivity between cloud services and data centers, while network visibility tools give network admins a holistic view of these highly complex cloud environments. By integrating these and other tools, organizations can preemptively identify and address potential issues to help ensure an optimized and efficient cloud environment.
Popular Network Monitoring Tools
What are the best network monitoring tools in today’s market? The answer depends on your unique needs and priorities. Every tool has its pros and cons; in the end, the best solution is the one that best meets your needs.
Here’s a compilation of some of the top network monitoring tools currently available, including some that are specifically Windows network monitoring tools. Some are free while others require a subscription or licensing for full functionality. Many of these solutions provide functionality across several of the categories described earlier.
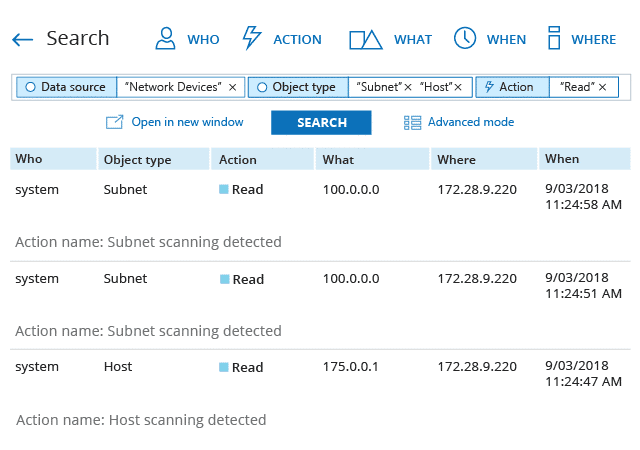
Netwrix Auditor for Network Devices
It’s not enough to detect network device performance issues; system administrators need to be able to quickly determine the cause of the issue and fix it. To do that, they need to be able to inspect configuration changes and other activities.
Netwrix Auditor for Network Devices delivers reports and alerts detailing what was changed on each network device, who made each change, and when it happened, with the before and after values. The reports also reveal both successful and failed attempts to log on to network devices, directly or over VPN connections. In addition, they provide port scanning information and details about hardware issues such as a power supply failure or critical CPU temperature. Netwrix Auditor for Network Devices enables you to detect scanning threats before attackers can take control of the entire network infrastructure.
Netwrix Auditor has a powerful built-in search of audit data, alerts on threat patterns, and behavior anomaly discovery functionality. It supports Fortinet FortiGate, Cisco ASA, Cisco IOS, Palo Alto, SonicWall, Cisco Meraki, HPE Aruba, Pulse Connect Secure, and Juniper network devices. Plus, it has a RESTful API engine that enables you to connect it with other software solutions, such as Nutanix, Amazon Web Services, ServiceNow, ArchSight, IBM Qradar, Splunk, Alien Vault, and LogRhythm; you can receive data from or send data to these solutions. Product installation is straightforward, and the UI is user-friendly and fast.
- Mitigate weakness with risk assessment: identify data and infrastructure security gaps, such as large number of directly assigned permissions or too many inactive users.
- Streamline User Access Reviews: Enforce the least privilege principle by delegating access reviews to data owners to approve current permissions or request changes with the access review module.
- Receive alerts on threat patterns: Detect suspicious activities around sensitive data and respond in a timely manner before a data breach or system failure.
- Save time with change, access and configuration reports: quickly get the information required for auditors, management and other stakeholders, instead of gather information from decentralized systems.
In short, Netwrix Auditor for Network Devices is not just a really valuable monitoring tool; it’s an enterprise-level software platform that gives you complete visibility into changes, configurations, and access across your network infrastructure. Netwrix Auditor has a free 20-day trial; during that period, you can not only evaluate. but also Netwrix Auditor for Network Devices, but also all the other Netwrix Auditor applications, which cover systems such as Active Directory, Group Policy, Microsoft Entra ID (formerly Azure AD), Exchange, Microsoft 365, file servers, SharePoint, Microsoft SQL Server, and VMware. Netwrix also offers a Netwrix Auditor Free Community Edition that is ideal for small networks that lack the resources to justify a full enterprise solution.
Paessler PRTG
The Paessler PRTG network monitoring tool offers comprehensive network monitoring suitable for businesses of many sizes. This dynamic Windows-based solution can monitor a variety of IT assets, like firewalls, servers, and databases.
- Maps and Dashboards: Visualize the network with real-time maps and live status information. Create and customize dashboards with PRTG map designer
- Multiple user Interface: Edit multiple monitoring objects at once on the PRTG app for desktop, a versatile web interface, and apps for IOS and Android platforms.
- Distributed monitoring: monitor an unlimited number of remote locations with unified insight in one central, easy-to-read dashboard.
- Customizable reporting: Customize report templates according to the requirement and export them in different formats.
Templates help ensure swift setup. No device agents are needed, and data is securely integrated via SSL-encrypted protocols. The on-prem version installs on a Windows Server with shared access and can monitor up to 1,000 devices. Paessler offers a cloud-hosted version as well. There is no free version, but you can download a free trial version.
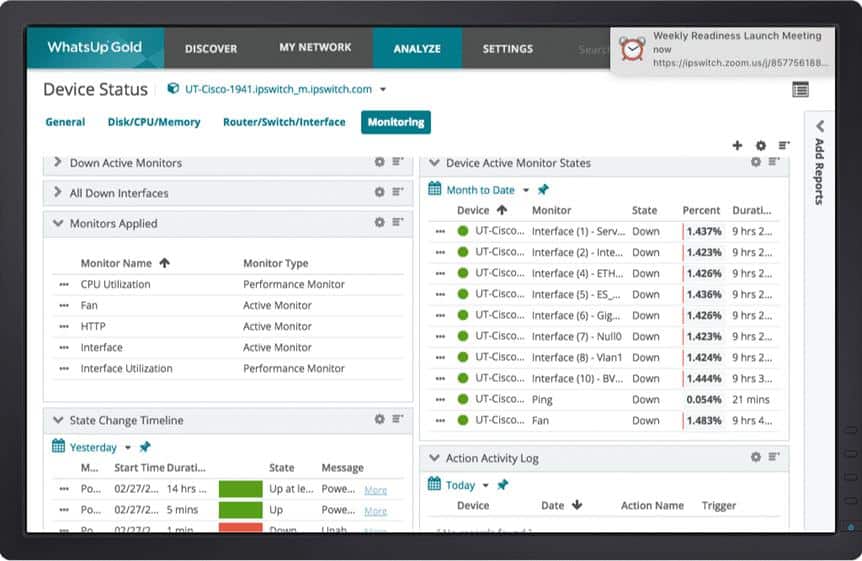
Progress WhatsUp Gold
Progress WhatsUP Gold offers robust monitoring for applications, networks, and systems. Its interactive map provides a comprehensive view of physical, virtual, and wireless networks and enables users to zoom in to see device-specific information.
After identifying connected devices through advanced discovery, admins can apply standard or custom roles to streamline the monitoring process. WhatsUp Gold uses active monitors for real-time device status and passive monitors for logs.
The solution tracks system metrics and alerts support teams of poor performance via email or SMS, empowering them to resolve issues before they can affect the user experience. One standout feature is its action policy for responding to state changes like router downtimes. While there’s no free version, a free trial is available.
- Application performance: Monitor the performance of the Linux systems, Apache web servers, and Microsoft applications.
- Network Performance: Whatsup Gold detects and fixes problems before end users are impacted.
- Wireless networks: Whatsup Gold can visualize and ensure the performance of wireless networks.
- Cloud-based Resources: Whatsup Gold provides comprehensive visibility and control of AWS and Azure cloud environments.
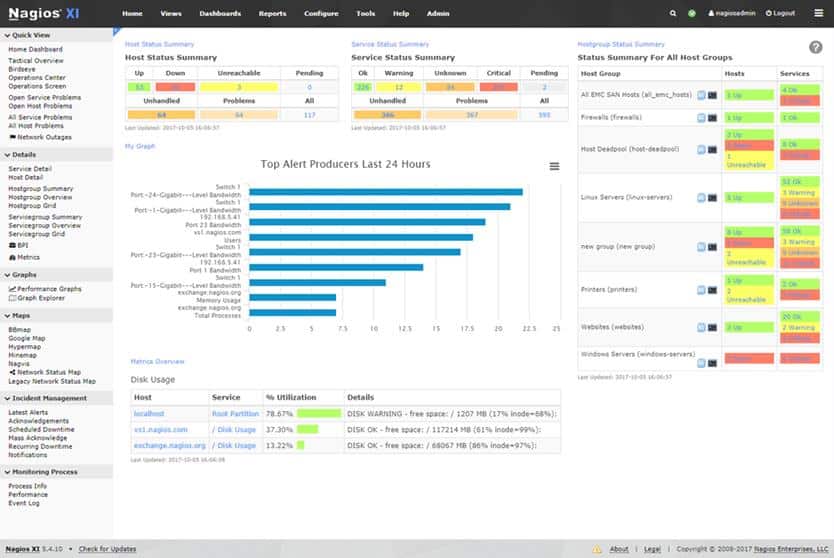
Nagios XI
Nagios XI is an advanced network monitoring tool built on the open-source Nagios Core software. While the platform provides a comprehensive web interface, its complex configuration may prove a steep learning curve for less experienced users. However, its ability to monitor everything from server RAM usage to FLEXlm license manager tool metrics makes it a highly versatile tool for large networks.
Supported by an active community, Nagios XI offers various plug-ins and a customizable notification mechanism via email, SMS, and instant messengers. Its visual display function presents a network’s logical layout and color-codes any issues. Although the configuration might be challenging, the server and network insights it offers are invaluable. Nagios XI offers a free 30-day trial. Its licensed version comes in both standard and enterprise editions.
- Powerful Monitoring Engine: Nagios XI uses the powerful Nagios Core 4 monitoring engine to provide users with efficient and scalable monitoring.
- Infrastructure Management: Simplify Management with improved Bulk Host import, Auto-Discovery, Auto-Decommissioning, and more.
- Configuration snapshot: This saves the most recent configurations, archives them, and allows reversion whenever necessary.
- Advanced Graphs and More: Administrators can easily view network incidents and resolve them before they become major catastrophes.
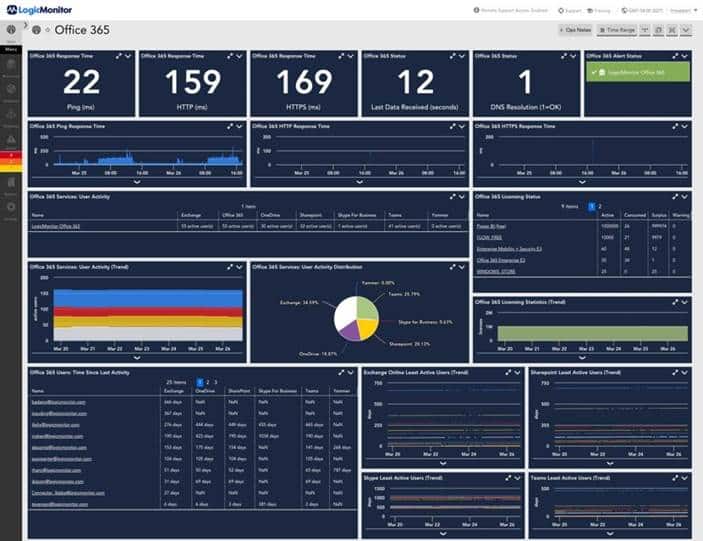
LogicMonitor
LogicMonitor is a cloud-based SaaS service designed to monitor physical, virtual, and cloud networks. Admins need to install only a small client app on Linux or Windows systems to enable automated discovery of devices like routers, servers, and applications.
The ready-to-use dashboard displays real-time performance indicators, system errors, and statuses, sourced from over 20 protocols like SNMP and JMX. Service alerts can be prioritized, with customizable escalation rules and reports available in various formats. Report configuration does require prior knowledge of desired metrics. Offers a free trial. Pricing is based on the number of devices, not individual monitors.
- AIOPS: Immediate actionable alerts with dynamic topology and out-of-the-box AIOPS capabilities.
- Reduced MTTR: Real-time alerts, seamless pivoting between monitoring and investigation with unified data, including integrated logs.
- Easy to deploy: Transform monitoring in minutes with dashboards over 2000 types of infrastructure and applications.
ntopng
ntopng is a network monitoring tool featuring an intuitive web interface. Like the Unix ‘top’ command for processes, it displays network usage in real time. Besides providing clear graphs and tables of current and historical traffic, its modular architecture supports numerous add-ons.
One powerful feature of ntopng is its traffic control capabilities. When network issues occur, network support teams can swiftly identify problematic segments and responsible hosts, ensuring unparalleled network visibility.b A free trial is available.
- Packet Capture: Wire-speed packet capture and transmission using commodity hardware with PF_RING. Zero-Copy packet distribution across threads, applications, and Virtual Machines.
- Traffic Recording: 100 Gbit lossless network traffic recording, supporting Layer-7 on-the-fly indexing to quickly retrieve interesting packets using fast-BPF and time interval.
- Traffic Analysis: High-speed web-based traffic analysis and flow collection using ntopng. Persistent traffic statistics in RRD and Influx format. Full historical data to ClickHouse and big data systems. Layer 7 analysis based on nDPI.
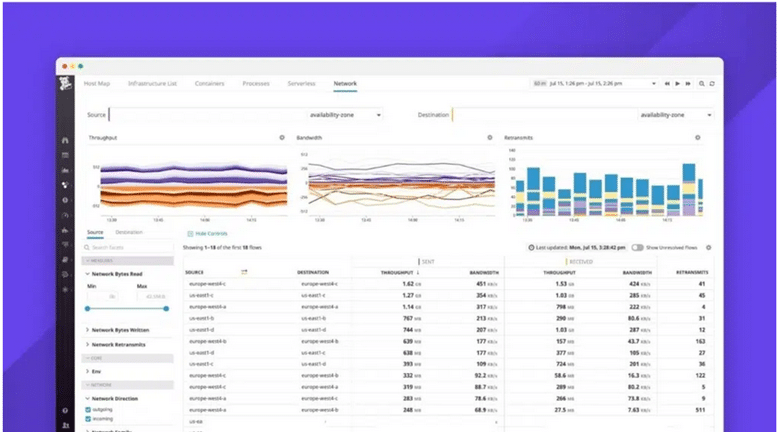
Datadog
Datadog is a SaaS platform that offers monitoring and analytics for software developers, operations teams, and business leaders navigating the cloud era. It integrates infrastructure monitoring, application performance monitoring, and event log management. With over 120 integrations, Datadog offers comprehensive metrics from every key tech component, facilitating data analysis and graphing.
Datadog provides a unified, real-time view of a company’s entire technology stack, including both on-premises and cloud deployments. It monitors Linux and Windows virtual machines, servers, and workstations, with specialized configurations for various products, including Windows services and cloud services like AWS, Microsoft Azure, and Google Cloud. Datadog offers a subscription-based model. A free trial is available.
- Cloud Network Monitoring: Pinpoint network issues by visualizing the hop-by-hop path taken by traffic between applications across cloud, physical, and wide-area networks. Improve MTTR by identifying intermediate hops, metrics, latency, and packet loss details. Track and alert on service-to-service interactions and metrics to monitor network performance between applications.
- Network Device monitoring: Automatic discovery and insights from devices across any vendor, including Juniper, Cisco, Meraki, F5, Arista, and Aruba. Leverage out-of-the-box dashboards to correlate across critical signals, devices, and overall site health.
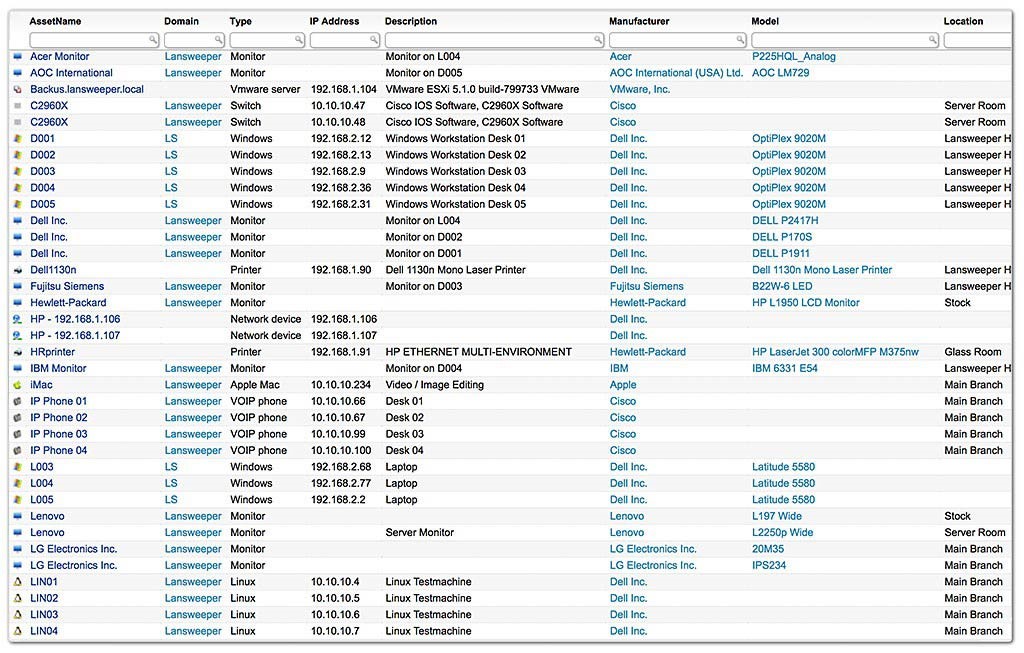
Lansweeper
Lansweeper specializes in the discovery and inventory of hardware and software across networked devices for better management and auditing. It can gather information from Windows, Linux, Mac and other IP-addressable devices. Reports, which are stored in a SQL Compact or SQL Server database on a Windows machine, aid in problem identification.
Besides its primary discovery function, Lansweeper offers a ticket-based helpdesk for issue tracking and a module for software updates. While it can operate without the need for installed agents, it may require them for intricate settings. Lansweeper provides a limited freeware version and a full version with a 20-day trial.
- Discover Every Asset: Find every IT, OT, IoT and cloud asset across infrastructure, managed, unmanaged or shadow to reduce risk, stay complaint and act with confidence.
- Keep Inventory current: consolidate all inventory data into a single, always accurate source of truth, that powers IT, security and finance to eliminate chaos.
- Tun data into Insights: use dashboards, vulnerability data, lifecycle insights and benchmarking to spot risk and reduce attack surface.
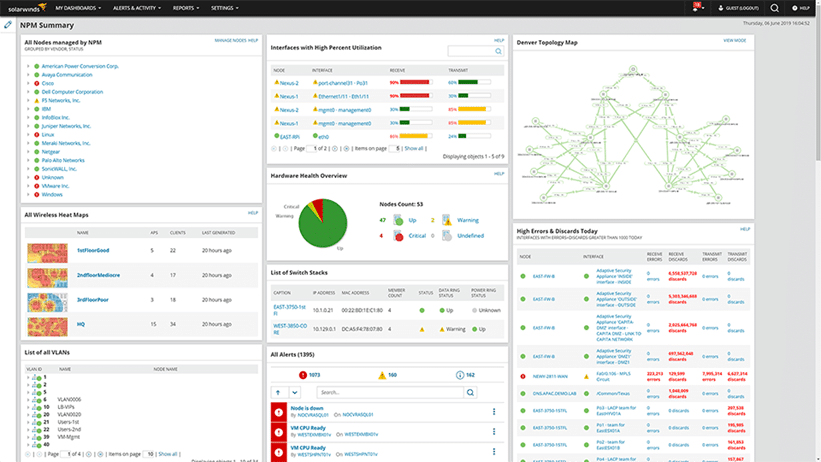
SolarWinds Network Performance Monitor
SolarWinds Network Performance Monitor helps IT pros efficiently detect and resolve network issues before they can cause downtime. It includes interactive network maps and automatic component detection, facilitating effortless scalability and alignment of critical processes. The application monitors response time, availability and up time of SNMP-enabled devices, overseeing factors like bandwidth, delays and CPU usage. You can configure alerts based on device conditions to focus on crucial network matters.
The user-friendly interface gives a comprehensive network view, with statistical baselines for quick issue resolution. The NetPath feature simplifies troubleshooting by tracing the network path from source to destination, proving useful even when traceroute falls short. This performance monitoring tool is subscription-based but comes with a free trial.
- Visualize Critical network paths: Identify and visualize critical paths end-to-end for optimal network performance monitoring and easy root cause attribution.
- Auto-Map Hybrid Network: Automatically create intelligent maps of on-prem and hybrid networks to simplify management and monitor network performance.
- Advance alerts: set up advanced alerts, including anomaly-based alerts with AIOps, to respond quickly to network outages.
- Custom dashboards: Create customizable dashboards to monitor network performance metrics that matter the most.
Observium
Observium is a network monitoring platform that offers a user-friendly interface to monitor your network’s health and status. It easily discovers a diverse range of devices and operating systems, including Cisco, Windows, and Linux. While it primarily uses SNMP for discovery and monitoring, it can incorporate data from other protocols like syslog and IPMI.
Observium is best suited for medium to large networks. The paid version provides periodic notifications. Observium has both a free Community edition and commercial subscriptions. For open-source enthusiasts, LibreNMS, a fork of Observium’s last GPL-licensed version, is available.
- Rule Based Automatic grouping: organize devices into logical groups using customizable rules like device type, location, IP addresses range, Operating systems.
- Network mapping through discovery protocols: Identify and visualize devices through network discovery protocols such as LLDP, CDP, and SNMP.
- RESTful API: Structured REST/JSON-based API enables access to data held in Observium’s MYSQL database.
What are the Benefits of a Strong Network Monitoring Tool?
Network Monitoring tools ensure the health, security, and performance of IT infrastructure, providing real-time visibility into the network operations, optimizing resource utilization, and ensuring business continuity. Some of the key benefits of implementing a strong network monitoring system are as follows:
- Proactive Issue Detection: Detects potential problems like high latency, packet loss, performance bottlenecks or device failure before they impact end users or business operations.
- Reduced Downtime: Automatic alerts to IT Team help in identifying critical issues early and prevent small problems from escalating into services downtime.
- Increased Security Awareness: Monitor unusual traffic patterns, unauthorized access attempts, and suspicious activities that could indicate a cyber threat.
- Optimized network performance: Provide insights into bandwidth usage, traffic patterns, and device health state, which helps in allocating better resources and network tuning for optimal performance.
- Streamlined troubleshooting: Visual maps, logs, and performance metrics pinpoint the exact location and cause of network problems, reducing the mean time to repair (MTTR).
- Regulatory compliance support: maintains records and network data logs, providing necessary evidence for regulatory compliance and internal security audits.
Improve Your Network Monitoring Capabilities with Netwrix Auditor.
A strong Network Monitoring tool plays a crucial role in securing and maintaining optimal performance of network devices and applications. Network tool monitors performance by keeping track of network speed, bandwidth usage, and resource health. Availability of devices and applications is monitored to address outages before they impact business operations. Network traffic is monitored to identify bottlenecks, manage bandwidth, and optimize network usage. Security monitoring helps in the detection of suspicious activities, unauthorized access attempts, and vulnerabilities to strengthen network defenses. Cloud monitoring extends visibility and protection into cloud-hosted infrastructure, services, and applications.
Netwrix Auditor provides risk assessments for data and infrastructure security gaps, receives alerts on suspicious activities, and integrates with other security, compliance, and IT automation tools with RESTful APIs.
Case studies such as Horizon Leisure Centres and Clackamas Fire District provide insight into how Netwrix Auditor saves time in data identification and protection in no time. Lowers risk of ransomware attacks, provides centralized visibility into user activity, and streamlines regulatory compliance, saving a substantial amount annually in audit preparation and ransomware protection.
Horizon Leisure Centers
A nonprofit organization states that Netwrix enables them to be proactive towards GDPR compliance with Netwrix Data Classification and Netwrix Auditor combined. Their IT Manager, Iain Sanders, chose Netwrix Auditor for its search and reporting features. Below are some facts about their infrastructure.
- They have data in over half a million folders.
- It would take two weeks’ manual work by four IT specialists to find all data for a single person.
- It would take months of manual work with four additional employees to get a full scan of the total data.
- With Netwrix tools, they have saved over £80,000 per year for those extra employees.
- Netwrix enabled them to perform the months-required job within minutes.
Clackamas Fire District
Clackamas Fire District states that it is important for them that Netwrix Auditor works 24/7, assisting them at any time of the day with peace of mind for visibility essential for their data security and continuous compliance. Their IT director Oscar Hicks chose Netwrix Auditor for deep visibility into user activities, file permissions, data access and modification, below are some facts.
- To complete the internal audit, they used to spend 3-4 weeks.
- They would need two full-time employees for system monitoring.
- With Netwrix Auditor, they were able to complete internal audits within 2 days.
- With Netwrix Auditor, they have saved $190,000 per year for the two full-time employees they used to have.
- With Netwrix Auditor, they now have 24/7 protection against ransomware.
Network Monitoring Tools FAQs
What is a Network Monitoring Tool?
A network monitoring tool is a software application or set of applications designed to continuously observe and analyze the performance, availability, and health of network infrastructure. These tools collect data from network devices like routers, switches, servers, and firewalls, providing real-time insights into network traffic, device status, resource utilization, and rapid detection of potential issues.
How Do Network Monitoring Tools Improve Security?
Network Monitoring tools enhance security by providing real-time visibility into network activity, detecting unusual traffic patterns, unauthorized login attempts, and suspicious data flow that might indicate a cyber attack or security breach. Provide alert mechanisms and automatic remediation response such as isolating compromised devices, blocking malicious traffic, and forensic analysis to prevent further damage and harden network defenses.
Which Metrics Should I Consider When Evaluating Network Monitoring Tools?
When evaluating network monitoring tools, look for features that allow monitoring wide range of devices and applications for their uptime and availability, bandwidth utilization, latency, packet loss, error rates, device health, applications response time and transaction rates. Additionally, tools should offer customizable dashboards, alert mechanisms, historical data analysis and support common network protocols like SNMP, NetFlow or ICMP.
How Does AI Improve Network Monitoring Capabilities?
AI-powered tools can leverage machine learning algorithms to establish baseline normal network activity behaviors, reduce false alerts, and identify anomalies to predict potential issues before they impact infrastructure or disrupt services. Reduce workload from IT Teams for manual redundant tasks and help them manage complex networks with accuracy and efficiency.
Which Protocol is Typically Used for Network Monitoring?
The Simple Network Management Protocol (SNMP) is the most commonly used protocol for network monitoring, enabling monitoring tools to query devices for data such as interface status, CPU usage, error counts, receive event notifications (traps), and modify configurations. SNMP agents are deployed on devices to collect data, send traps to SNMP managers, which centralizes management and enables organizations to monitor and manage a wide range of devices from a single dashboard.
What are the Benefits of a Network Monitoring Tool?
Network Monitoring tools provide several benefits, including proactive issue detection, reduced downtime, improved operational efficiency, and security. Centralized management dashboards provide visual maps of networks, performance metrics of different devices categorized according to device types, and historical data is recorded for network performance comparison and regulatory compliance requirements. Alert mechanisms provide an early heads-up before catastrophic failure of services, forensic details help in troubleshooting, speedy recovery, and business continuity.
What Range of Historical Data Should a Network Monitoring Tool Consider?
A strong network monitoring tool should store a wide range of historical data, spanning from a few weeks to months or even years, with export functionality for archiving. Historical data metrics depend upon the organizational needs for trend analysis and long-term capacity planning. Long-term data retention enables organizations to establish a baseline of normal network behavior, predict future bottlenecks, and facilitate post-incident analysis. The ability to retain and provide analysis on extensive historical data metrics enables informed decision-making regarding network upgrades, efficient resource allocation, and troubleshooting recurring issues.
How Do Network Monitoring Tools Integrate with Ticketing Systems?
Network Monitoring Tools often integrate with IT service Management tools (ITSM) or ticketing systems through APIs or plugins. When the monitoring tool detects an issue, i.e., device failure or bandwidth issues, it automatically creates tickets with relevant details like affected device, problem description, and severity. This integration streamlines incident management with assurance that network problems are promptly identified, and appropriate teams respond to address issues in a timely manner, with a centralized record.